Covid-19 midterm projection for continued Lockdown (covidMT_LD) covidMT_LD
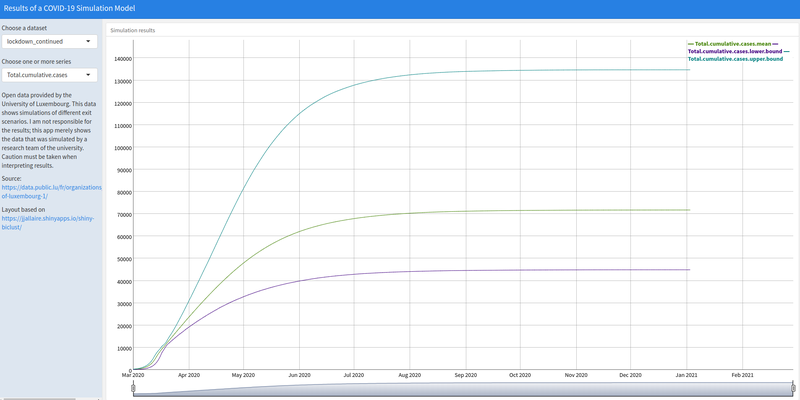
This file describes midterm projections for Luxembourg predicting the number of assumed positive Covid-19 cases, ICU demands and deaths cases for a continued Lockdown. The projections are obtained by a stochastic agent based epidemiological model and gives for each average value also a 90%…
Metadata quality:
Data description filled
Files documentation missing
License filled
Update frequency not set
File formats are open
Temporal coverage not set
Spatial coverage not set
All files are available
Updated on April 24, 2020


