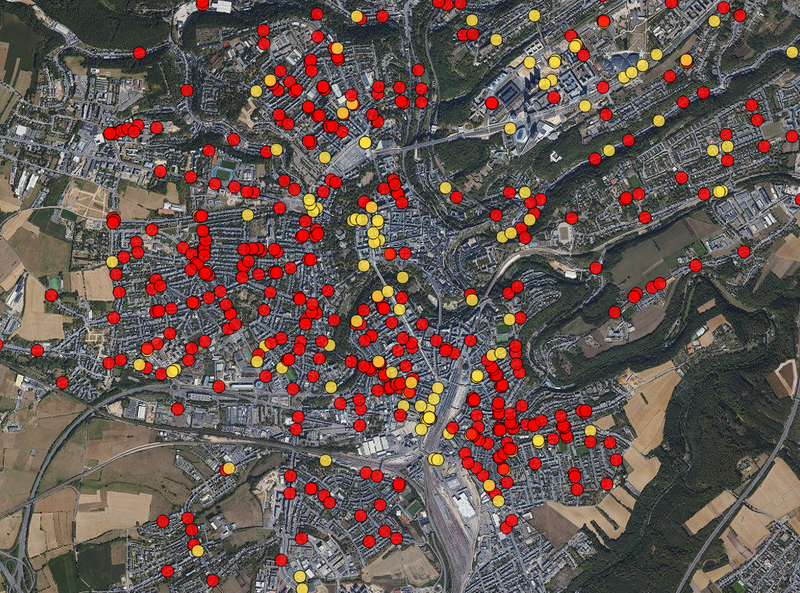
Inondations.lu widget shown in geoportail
Visualization
Published on June 24, 2022 by Administration de la gestion de l'eau

Published on March 12, 2017


The Application has the potential of improving the quality of life and the efficiency of the heatlh care system in Luxembourg. If available the app would datasets with regards to doctors, hospitals and pharmacies across Luxembourg. Additionally, the geoportail dataset can be used with the Point of Interest layer in order to visualize the locations of these POIs. Last but not least traffic data can be used to calculate the optimal route to the POI.
The Application is deployed on SAP Hana Cloud Platform and the sources of the application are maintained on github at url: https://github.com/plaiasuandrei/Hackaton.git
Discussion between the owner and the community about this reuse.
Discover more reuses.
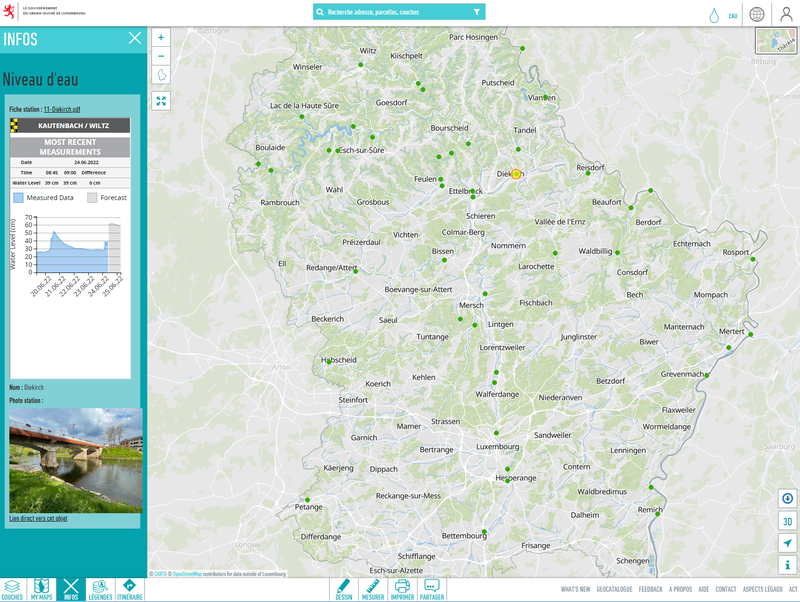
Visualization
Published on June 24, 2022 by Administration de la gestion de l'eau
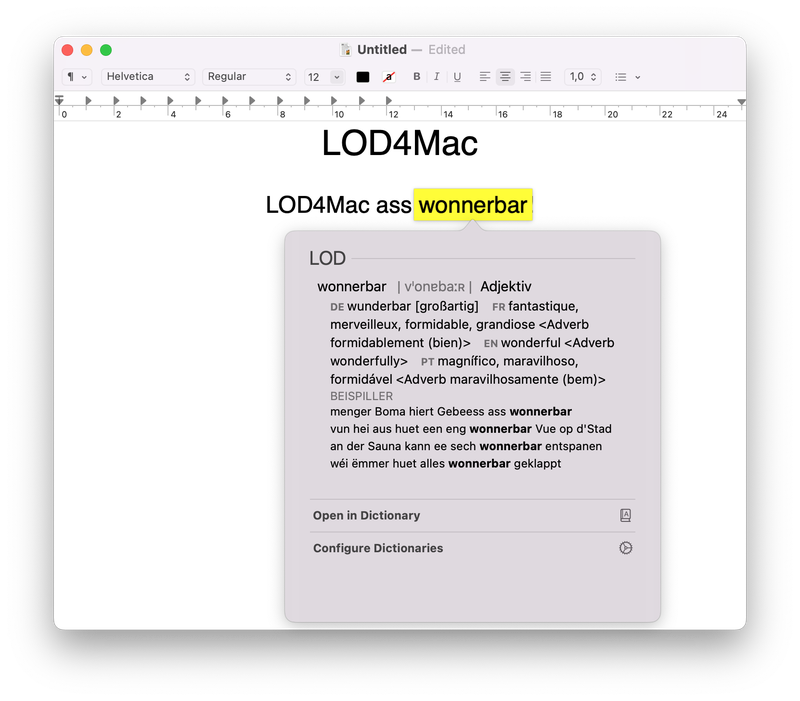
Application
Published on May 27, 2022 by Zentrum fir Urban Gerechtegkeet