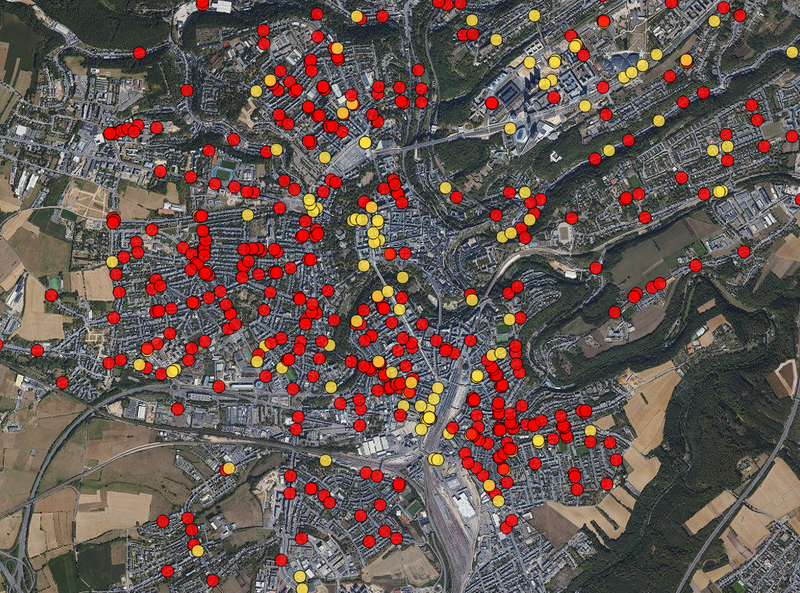
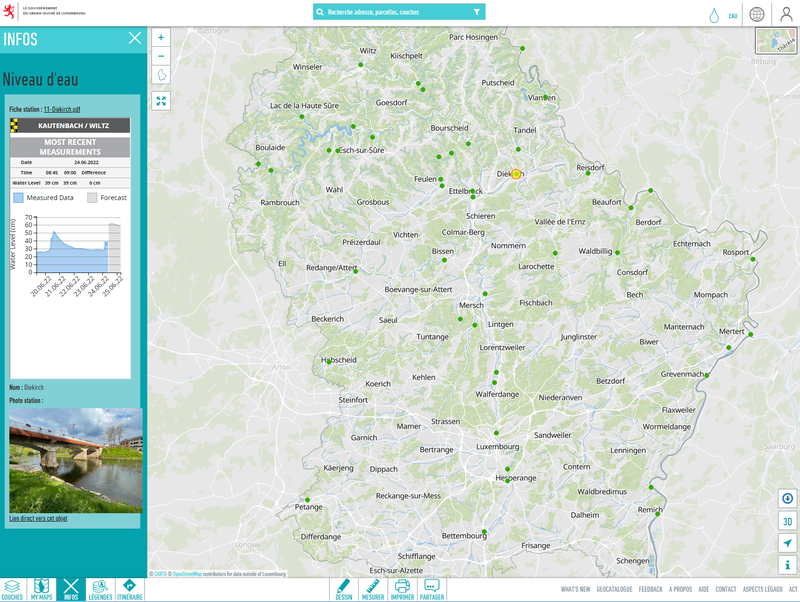
Inondations.lu widget shown in geoportail
Visualisation
Publié le 24 juin 2022 par Administration de la gestion de l'eau

Publié le 17 mars 2018

1 réutilisations
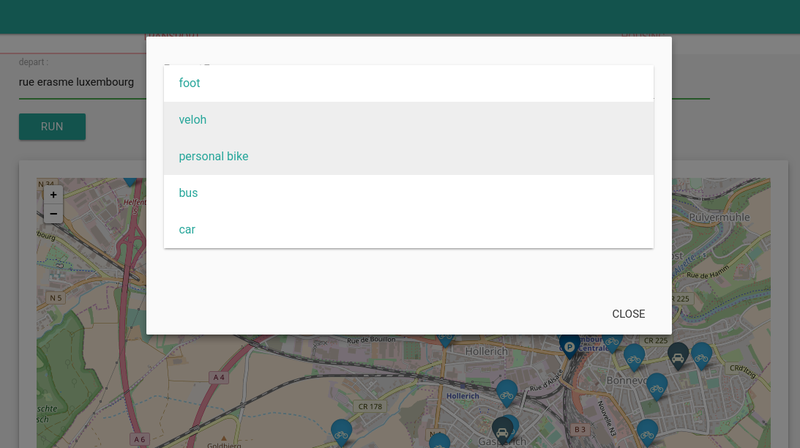
Rdata.lu's contribution to the Game of Code 2018 - Open Data Challenge
We used various data sets, most from the Open data portal to build a Shiny web application. The app helps you make your commute smarter by telling you which bus lines, public bikes, public cars and more you can use.
You can run the app here:
You can also run the app locally by running the map.R script in the /app folder.
The /code folder contains a bunch of R functions that download/update the data. A lot of the data used is download into the /data folder. This might seem archaic compared to using relevant apis, but there are good reasons to it this way: first, there is no api for bus lines; instead, the Verkéiersverbond publishes GTFS files. There is an api for real time access to the buses and stops. However, there seems to be a daily limit (as per the comments here). This is why we decided to use the GTFS files for the bus.
For the public bicycles, we use the real time api to know if bikes are available for a given station, but we also have downloaded the gps coordinates of the bike stations. This makes it easier to put them on a map and draw paths between them.
For carloh, we downloaded the stations. As far as we are aware, there is no real time api for carloh yet.
Weather alerts get automatically updated every time you start the app.
The chargy api was down the day of the datathon, so we did not integrate it to our app.
Discussion entre le producteur et la communauté à propos de cette réutilisation.
Découvrez davantage de réutilisations.
Visualisation
Publié le 24 juin 2022 par Administration de la gestion de l'eau
Application
Publié le 27 mai 2022 par Zentrum fir Urban Gerechtegkeet